
I bet you’ve never been excited about the idea of putting data into tables. Me neither. Tables suck, but they’re a necessary evil. They provide tables in TradingView, but they are memory intensive (you’re only supposed to render them on the last bar of your chart so you don’t blow your memory allotment), and they are kind of a pain in the butt to build out. If you’ve ever written an indicator in TradingView that used tables, you know what I’m talking about. And if you ever get to the stage where you need to conditionally have cells with row or col spans, you’re going to hate life pretty quickly. After a few hours of debugging tables, I got a great idea for how to improve them in TradingView. Wouldn’t it be awesome to just be able to dump out a table of data so you can see what is going on with your indicator?
Well, now it is.
My original idea was to just be able to drop out a string to the screen. Then I realized it would be awesome to dump out an array of data as a row of table cells. And finally, what if I had a whole matrix of data I wanted to dump out? Well, it’s not that easy because variables, arrays, and matrixes are all typed, so you would need to convert those to strings first. And then after you convert them to strings, you need to be able to style the cells. You have to be able to change the text/background colors, text alignment, etc. And last but not least, you need to be able to stretch cells across rows or columns sometimes. Yes, this library does ALL OF THAT.
So, let’s start with the most simple example where you’ve got a string you want to dump to the screen. Here’ what that would look like:
//@version=5
indicator("Table Examples", overlay=true)

import jmosullivan/Table/1

someString = "Hello World!"
Table.debug(someString)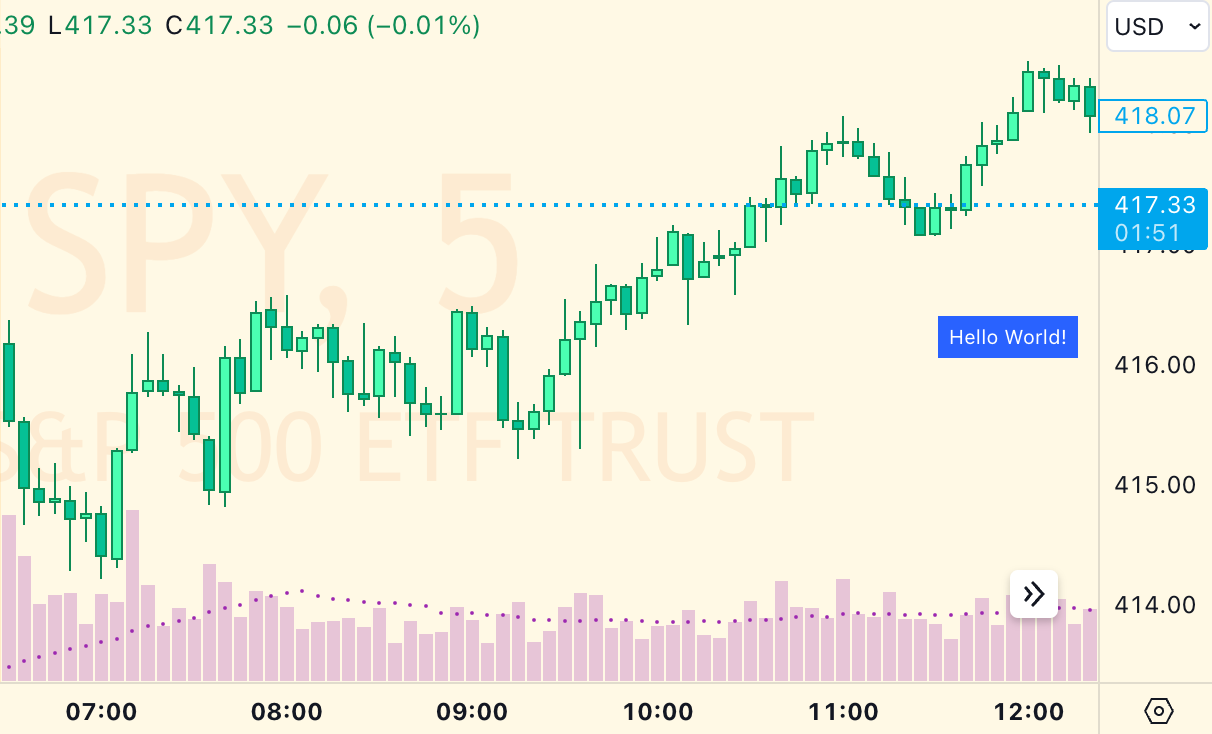
Okay, big whoop. I guess you could do that with labels or something. So let’s try something a little more complex. How about an array of float values, like the open, high, low, close variables?
//@version=5
indicator("Table Examples", overlay=true)

import jmosullivan/Table/1

ohlcArray = array.from(open, high, low, close)
Table.fromArray(ohlcArray, position.bottom_right)
Some important things to note here are:
- I was now calling a different function: fromArray(), and I passed it an array of float values.
- I added a second parameter that indicated where to place the table (bottom right)
First of all, I could have passed this function a string or float type of array, and it would have rendered it in the table. It just does the conversion for you. Second, position isn’t the only option available, there are a lot more like:
- position (string): uses the default position collection provided by TradingView.
- transposeTable (bool): flips the table from horizontal to vertical.
- verticalOffset (int): If the table is aligned to the top or bottom of the chart, it will introduce one row of space per number specified. So, 2 would introduce 2 rows of space between the table and the top if it was aligned to the top. This is helpful if you’ve got multiple tables coming in from one or more indicators and you don’t want them overlapping.
- textSize (string): uses the default size collection provided by TradingView.
- borderWidth (int): the name says it all, this introduces space between the table cells. I default this value to 1.
Okay, so let’s get a bit more complex. What about a matrix of data? I’ll fill a matrix with the ohlc values from the last 10 bars and render it…
//@version=5
indicator("Table Examples", overlay=true)

import jmosullivan/Table/1

m = matrix.new<float>()
i = 0
while i < 10
    matrix.add_row(m, matrix.rows(m), array.from(open[i], high[i], low[i], close[i]))
    i += 1

Table.fromMatrix(m, position.bottom_right)
So, now I’m passing the matrix variable I made to a new function called fromMatrix(). This function has all the same options as fromArray, and it also has overloads for different basic data types, too (float, string). Worth noting that when you are dealing with a matrix like this, you can transpose the table, so the ohlc can go left-to-right instead of top-to-bottom, like this:
Table.fromMatrix(m, position.bottom_right, transposeTable=true)
Up to this point, we’ve only dealt with data sets of one type. But what if we have a mix of data types? Like, what if we have a bunch of variables – ints, strings & floats – and we want do dump out all those values in a table? Well, the simplest way is to either use str.format() to write them into a single string and then Table.debug() them, or you can drop them into a string array like this:
Table.debug(str.format('Int: {0}\nString: {1}\nFloat: {2}', varInt, varString, varFloat))

arr = array.from(str.tostring(varInt), varString, str.tostring(varFloat))
Table.fromArray(arr)
That’s enough to get you going if you just want to debug stuff or have just the simplest presentation of data. But what if you want to customize alignment, background or text colors, etc? Well, that’s where you get to meet a new type I created for this library called Table.Cell. Under the hood, whenever you pass a string or array or matrix to the Table library, it converts all of the values to Table.Cell types. A Table.Cell type is defined in the following way:
// @type Type for each cell's content and appearance
export type Cell
	string content
	color bgColor = color.blue
	color textColor = color.white
	string align = text.align_center
	int colspan = 1
	int rowspan = 1
So, you can create a Cell to be inserted into a table with all of these properties, and then just insert it into an array of Cells, and pass *that* to the Table library, like this:
//@version=5
indicator("Table Examples", overlay=true)

import jmosullivan/Table/1

cell1 = Table.Cell.new(
  content="The current price is",
  bgColor=color.black,
  align=text.align_left
  )
cell2 = Table.Cell.new(
  content=str.tostring(close, format.mintick),
  bgColor=color.green,
  align=text.align_right
  )
Table.fromArray(array.from(cell1, cell2), position=position.bottom_right)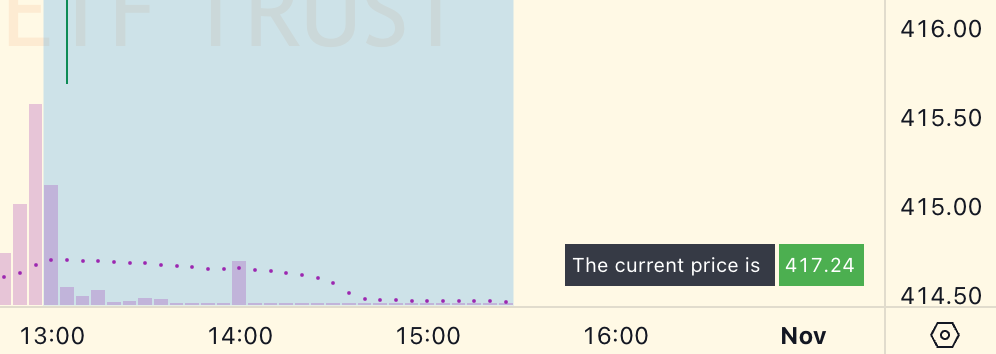
Last but not least, you can span cells across columns or rows, like this.
//@version=5
indicator("Table Examples", overlay=true)

import jmosullivan/Table/1

cell1 = Table.Cell.new(
  content="The current price is",
  bgColor=color.black,
  align=text.align_left
  )
cell2 = Table.Cell.new(
  content=str.tostring(close, format.mintick),
  bgColor=color.green,
  align=text.align_right
  )
wideCell = Table.Cell.new("This cell spans two others...", colspan=2)
blankCell = Table.Cell.new("")

m = matrix.new<Table.Cell>()
matrix.add_row(m, 0, array.from(cell1, cell2))
matrix.add_row(m, 1, array.from(wideCell, blankCell))
Table.fromMatrix(m, position=position.bottom_right)
In order to make it work within the confines of TradingView’s matrixes, I had to create a blank cell (that would ultimately be discarded when the cell to the left of it was spanned across) and put it into the matrix. But if you wanna make an omelette, you’ve gotta break some cells.
So that’s it!
This is a free, open-source library. You can check out all of the code and start integrating it into your indicators on TradingView.com now. Honestly, I’ve been using this library for the better part of a year in my private indicators and experiments, and it has increased my productivity 10-fold. I sincerely hope it can do the same for others.
Happy Coding!
