
Who doesn’t love getting in early when there’s a trending day in the market? There are so many signals to pay attention to that it is totally overwhelming to any trader, let alone a new one. One of the things we talk about a lot over in the ChartGuys.com community is recognizing when the sector ETFs are at the highs or lows of the day at the same time. You can imagine that if this is the case, it can be a signal that we are having a strong directional market that day. After we’ve noticed it once, we need to be watching for it to happen again. On a trend day, you want to see all sectors hitting highs together repeatedly and consistently. And if you see this happening, it can increase the odds of success on trades in the same direction.
About a year ago, with this idea in mind, I created an indicator called Symbols at Highs & Lows. All it does is watch for these conditions to occur, and shows you when it does happen in a table. I realized as I was writing the indicator that you can also apply this to specific sectors. For example, some days tech names will be super strong while other names and sectors are weak. So I built the indicator so you can customize your own set of names you want it to track. I open-sourced that indicator and published it on TradingView, and there are a lot of traders who use it every day.
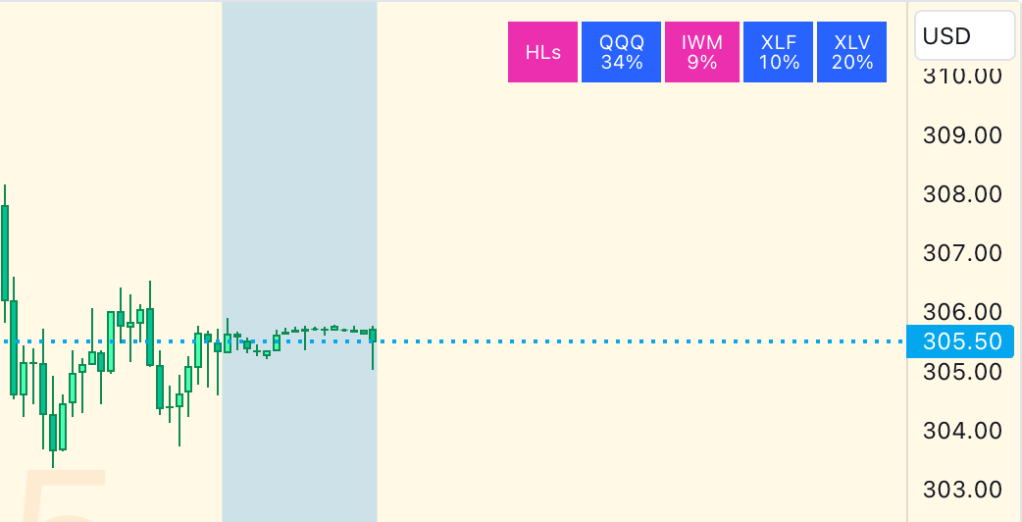
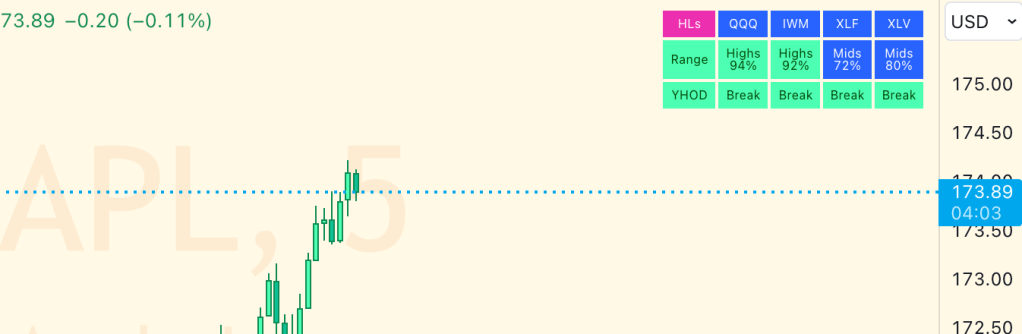
Since it’s release, I’ve come to realize that it isn’t just if the sectors are at the highs and lows of the day together. Another thing to watch is if the sectors have broken the high or low of the previous trading day. There’s a saying in trading, “You can’t short a stock that didn’t break down, and you can’t long a stock that didn’t break out.”
It is super important to know if the names you care about are breaking their highs and lows of yesterday. If they are, then that’s another signal to you that you need to be making trades in that same direction!
Today I’m releasing a new version of Symbols at Highs & Lows that provides this yesterday breakout info along with the existing info on today’s highs/lows.
Now that’s a lot of information in the table, and I try really hard to not clutter people’s screens with my indicators. So, it comes with a good set of options for controlling what to show and when to show it.
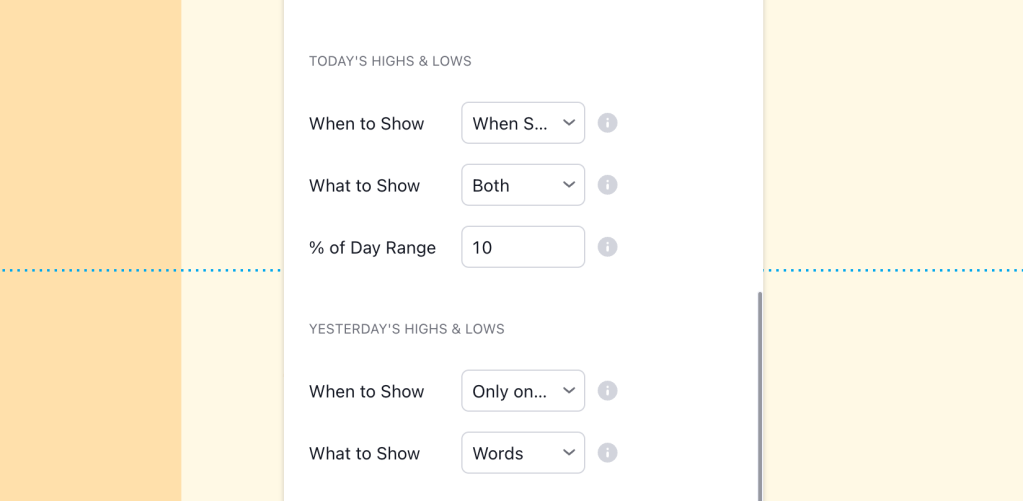
For today’s highs and lows, you have the option of having their row appear always, never, or only when one or more symbols is at the highs or lows. For yesterday’s highs and lows, you have the option of having their row appear always, never, or only when one or more of the symbols has violated the high or low of the prior day. The defaults are to only show up when these conditions are occurring. This way, the indicator will actually remain hidden a lot of the time – especially on inside days in the market.
Finally, the top-right is a popular place to put indicators, and I know a lot traders who also use my MM RSI Grid indicator, which appears on the top-right of the screen by default. In order to account for this, I’ve included a “Vertical Offset” option on my indicators that will push the indicator down (if positioned towards the top of the screen) or up (if positioned towards the bottom of the screen) so you can put both of these indicators in the same corner. The result is something like this:

Finally, like all of my free indicators, this one is open-source. You can get the latest version of Symbols at Highs & Lows over on TradingView.com now.
Happy Trading!
