
SMB Capital wrote a great blog post about RVOL back in 2015. In it, Mike Bellafiore from SMB writes:
“We use relative volume to gauge how In Play a stock is. […]
If RVOL is less than 1 it is not In Play on this trading day and I may decide not to trade it. If RVOL is above 2 it is In Play and this is more evidence I ought to be in the name. When stocks are *very* In Play you can see an RVOL of 5 and above. The higher the RVOL the more In Play the stock is.
I also use RVOL for position sizing. If RVOL is <1 I may decide not to take a *very* large position in the name. If RVOL is >3 this may give me more confidence to take a larger position as more reward and more liquidity should be present.”
I’ve spent quite a bit of time reviewing the indicators out there for RVOL, and none of them actually do it correctly. Most indicators use a rolling average of the prior 30 days which is super easy to do, but it doesn’t actually work properly because instead of getting large or small volume minutes from prior days filtered out correctly, it takes a LOT longer for those to even out as the rolling average eventually smooths down.
RVOL matters a lot in the initial minutes on a day, even in premarket, as you try to determine which stocks are in play. So, it’s important to get these values right! With this in mind, I set about creating my own RVOL calculation. I have spent way too much time working on this, and I’ve created multiple iterations of this indicator, but I’ve finally settled on this one so I think it’s a fair time to release it. I must confess, though, that I don’t actually use it in my day to day trading. There was a time when I was focused on in play stocks, but that time has now passed and instead I trade the same few symbols every day. So, I’m releasing this indicator for all those folks out there who trade SMB style, and I hope it helps you!
A bit more detail about my implementation…
This indicator shows you the “Relative Volume” (RVOL) value up to the current minute. RVOL is the volume from market open up to the current minute today, compared to the average of the same over the last n (30 by default) days.
How this script works:
Most people I know who use RVOL heard about it from SMB Capital. And SMB has their own custom-coded stuff at their firm to get this value for traders. Most of the attempts to get this value here on TradingView take shortcuts that really just don’t cut the mustard. What this indicator does is it grabs minute-bar data for the current chart and stores every minute’s data for the last 30 days, Then in real time it calculates the volume up to the current minute today with the average of the same up-to-the-minute data from the prior 30 days to calculate the relative volume of the stock. It’s super important to get this data up to the current minute, because most traders use this information primarily during the first 90 minutes of trading, and need to know if this value is going up or down.
As always, I’m releasing the full source code of this indicator so you can see the full implementation of how I did it. I had to do a couple of novel things to make it work in a performant way, so I hope you coders out there enjoy taking a look at the source.
How to use this script:
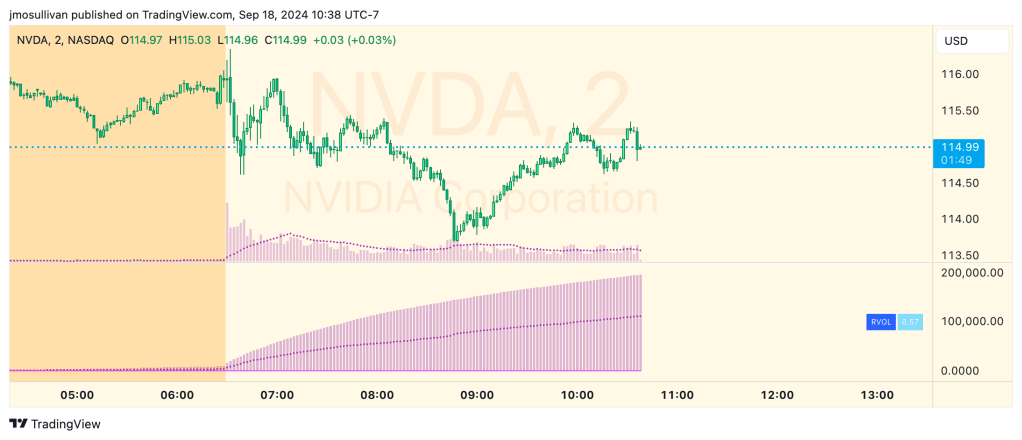
Just add it to your chart and watch the RVOL value printed on the right. It also shows you the minute-by-minute values if you want to see what they were.

Leave a comment