-
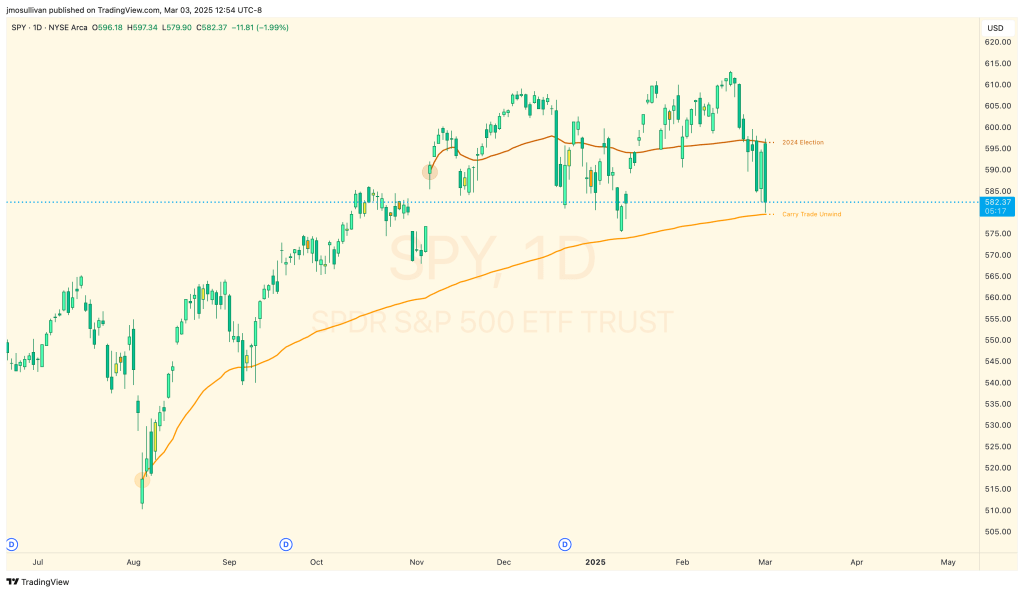
Labelled AVWAP
TradingView provides a tool to show anchored VWAP plots on your screen, but there is no way to label the plots to add additional context to the level. Instead, users are forced to use the plot style (color, line style, line thickness, etc) to indicate what the plots are for and then they have to… Read more
-
Trading with Edge
If you’re familiar with the content of this website, you know that I write a lot of code in Pine for TradingView. Prior to day trading, my background was in software development. When I began trading, I was quite shocked at how terrible the software is that traders use. It felt like the brokers were… Read more
-
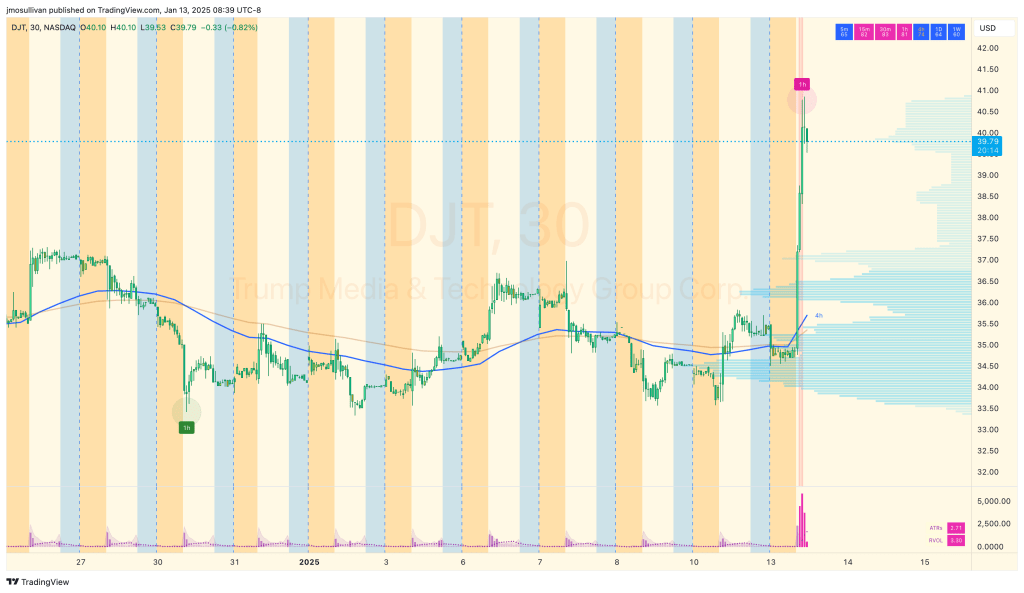
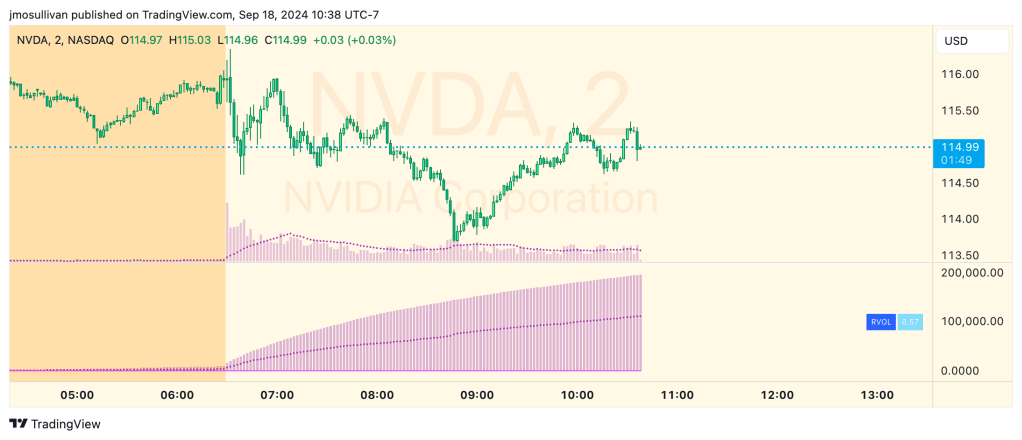
MM RVOL Update
Thrilled to release this new version of the MM RVol indicator. This is a game changer that helps you see when there are relative volume changes that you need to be paying attention to. Get it for free over at TradingView.com… Read more
-
MM RSI Grid – Holiday Update
Super excited to release this new version of the MM RSI Grid indicator as I’ve been tinkering with it for the better part of a year since I made the last update. The new version includes a bunch of improvements and configuration options, allowing you to better visualize overbought and oversold conditions on multiple timeframes.… Read more
-
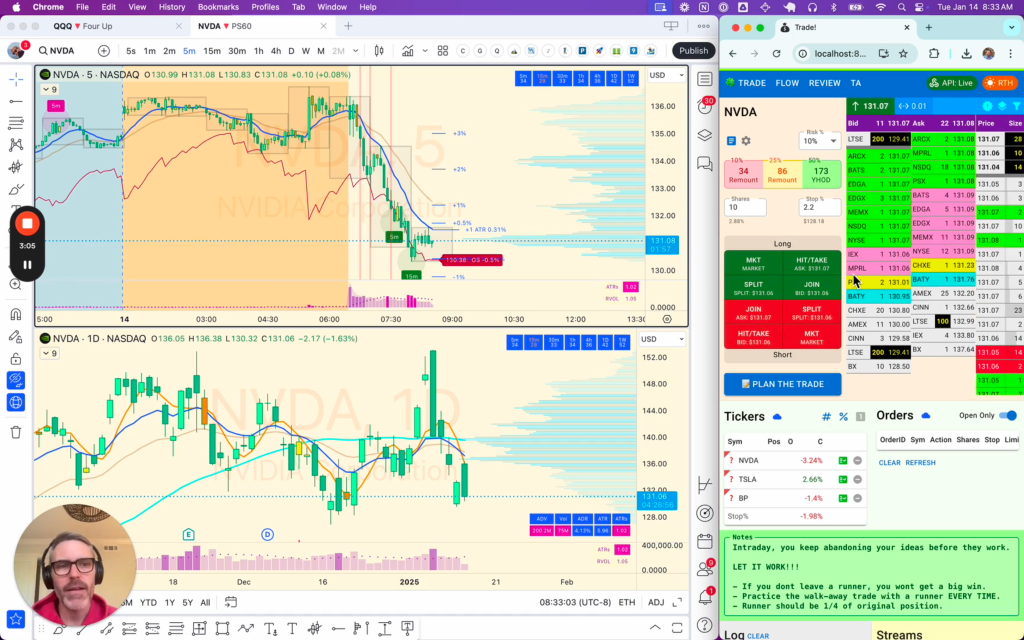
Relative Volume (RVOL)
SMB Capital wrote a great blog post about RVOL back in 2015. In it, Mike Bellafiore from SMB writes: “We use relative volume to gauge how In Play a stock is. […] If RVOL is less than 1 it is not In Play on this trading day and I may decide not to trade it. If… Read more
-
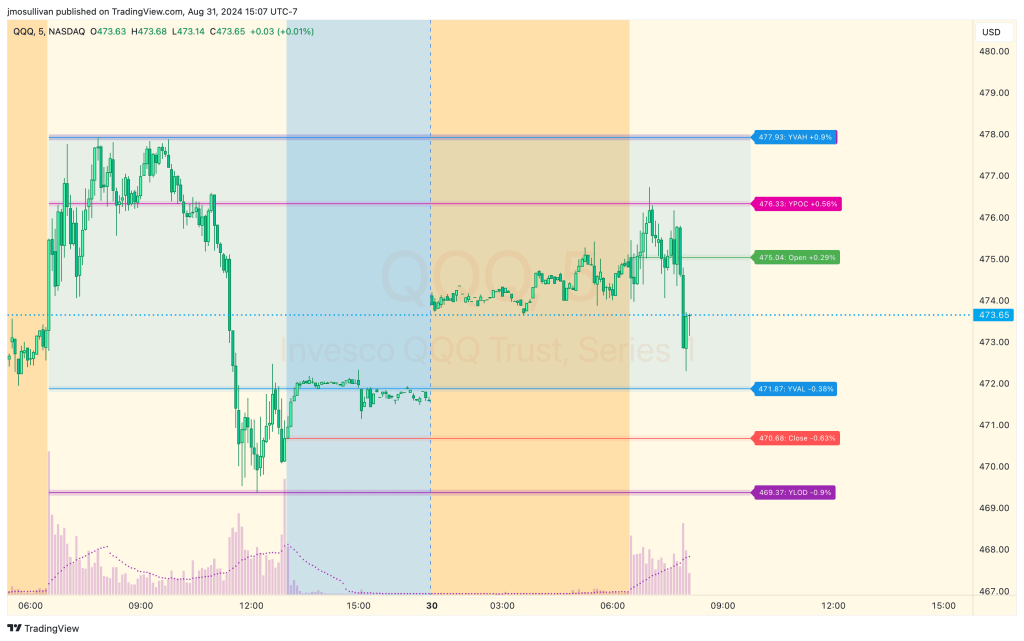
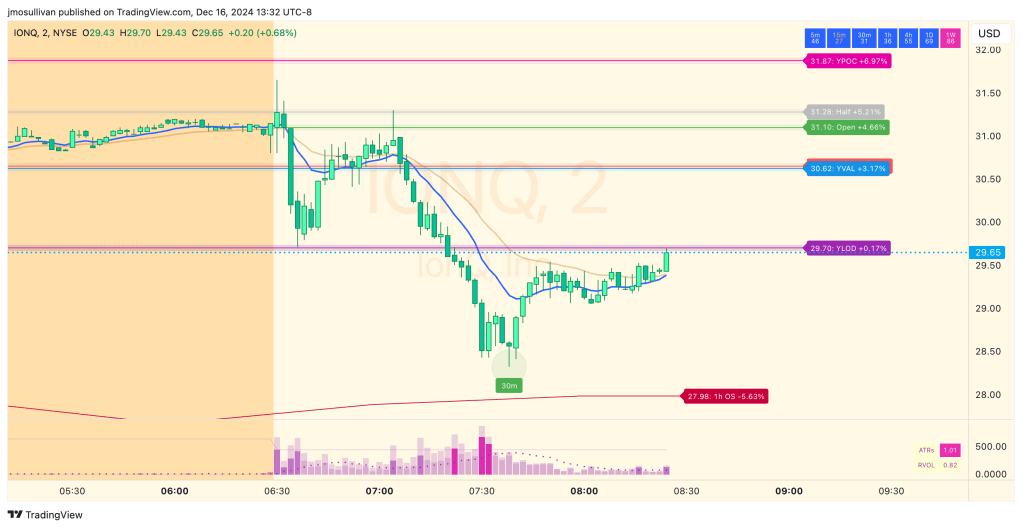
Day Trader Levels
As an intraday trader, there are certain key levels that I care about for short-term price action on every single chart. When I first began day trading, each morning I would painstakingly mark those key levels off on the charts I planned to trade each day. Depending on the number of charts I was watching,… Read more
-
Session Library
Last year I wrote an open source library for TradingView that enables you to define and use the Session Volume Profile in your indicators. The very first indicator I wrote afterwards was one that I’ve been using privately ever since, called Day Trader Levels. I knew when I wrote it that it would only work… Read more
-
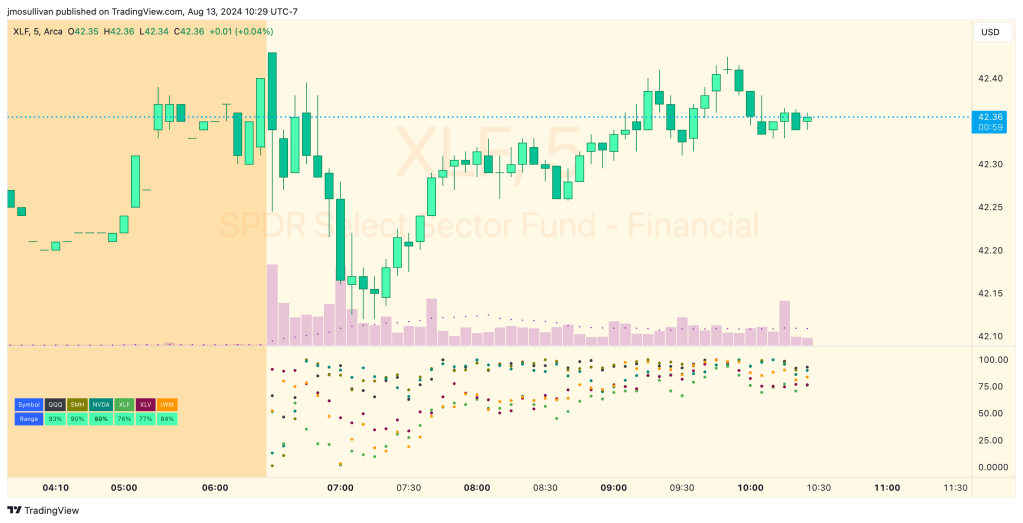
Market Range Map
What this script does:The purpose of this script is to help traders identify when the major sectors of the market are moving in one direction – also known as a “market trend day”. How this script works:The indicator uses QQQ, SMH and NVDA to represent the technology side of the market, and XLF, XLV &… Read more
-

Sector Intraday Tracker
What this script does:This script tracks the percent that price has moved from the opening print of each of the 11 sector ETFs. It color codes the values so you can see which sectors are down (red color) and which sectors are up (green color). If a sector is only up or down half of… Read more
-

MTF MA Levels Update
Today I’m releasing a new and improved version of the free Multi-Timeframe Moving Average Levels indicator over on TradingView. This release features the a bunch of changes & improvements: Get the latest version for free over on TradingView now. Read more

